
Part 2 of Cycling to a Greener Future
The last of the tangerine oak leaves scatter through the icy air, solitary bastions of colour against the pewter expanse of the autumn sky. The rich and heady smell of woodsmoke wafts across the paths and trails of Richmond Park, mixing with the sobering, mossy aromas of the encroaching winter and trumpeting the imminent arrival of many a Sunday roast. Squadrons of cyclists, thoughts set on these warm, gravy-laden prizes, charge through the freezing cold, gaudy parodies of the autumn colours. London cycling stops for no season.
Carbon footprints are a part of just about every human product and activity. Almost everything we create, destroy, do, or undo has an intrinsic effect on the amount of CO2e in the atmosphere and the stability of the ecosystems around us. As seen in Part 1: Carbon Footprint of A BIcycle, for a physical product like a bicycle, this can generally be calculated by summing the emissions of production, distribution, and eventual disposal. To get the full emissions profile for some products though, emissions between distribution and disposal have to be taken into account.
Before getting into the numbers, it’s worth considering the “per passenger per kilometre” framework this piece relies on; the same framework behind most carbon footprint calculators, food labelling schemes, and lifestyle-focused climate messaging. The framing comes from the idea of a “carbon footprint” itself, which was popularised by a mid-2000s advertising campaign for British Petroleum by the agency Ogilvy & Mather, inviting the public to calculate their own personal footprint.
Is Carbon Footprinting a Distraction?
Critics have argued that this individual framing can obscure and distract from the outsized role of a comparatively small number of large, industrial emitters; journalist Mark Kaufman, who investigated the campaign’s origins, writes that its effect was to put “as much blame on the consumer as possible” (Kaufman, 2020). Others push back on this with the idea that individual behaviour change and systemic reform aren’t mutually exclusive. The spread of carbon literacy through articles like this one, in fact, is needed to boost public support for broader structural change.
An alternative model already exists in UK policy history. Personal carbon trading, based on the concept of personal carbon allowances, would treat emissions as a rationed resource rather than a moral ledger: each individual receives a capped, tradeable carbon budget, and every action, including the food eaten to fuel a bike ride, draws down against it. There is no need to rely on voluntary awareness. The idea drew serious government interest in the mid-2000s and the House of Commons Environmental Audit Committee argued it “could be essential” for the UK to meet emissions targets (Environmental Audit Committee, 2008).
However, Defra’s own pre-feasibility study reached the opposite conclusion, judging the idea “ahead of its time” and citing high implementation costs and uncertain public acceptability; further government research was wound down in 2008 (Defra, 2008). The disagreement between the two government bodies is itself telling, suggesting the barrier to systemic carbon accounting isn’t technical, but political. In an obvious parallel, voluntary dietary nudges are currently what is intended to decarbonise cycling’s fuel emissions, and binding regulations are still out of favour.
Does Current Climate Policy Encourage Cycling?
Nothing in this article is personal dietary advice, nor is cycling something to put off due to one’s high-emissions diet. Carbon footprint tracking is about everyday personal choices involved in areas such as diet and commuting. The dietary coefficient at the centre of this piece belongs to a different register. It is a population-level, policy-facing accounting tool, built to answer questions such as how to shift a city’s commuters onto bikes, rather than whether an individual should eat less steak before their Sunday ride.
It works by assuming any extra calories a rider burns get replaced, prices those calories at the emissions intensity of an average diet or even specific dietary groups, and adds them to the bicycle journey carbon footprint. For an individual already tracking food and travel emissions separately, this can look like double counting: a bike ride does not create a new source of emissions, it makes an existing one, diet, marginally larger by however many calories are burned and then replaced. Those on low-emissions diets already have very little to consider further; those on higher-emissions diets need only understand that a slightly higher energy output/replacement costs slightly more on the emissions front, on a scale small enough for Table 1 and Figure 1 below to put an exact number on.
What is the Typical Carbon Cost of Shifting Commuters onto Bicycles?
In 2011, the European Cycling Federation (ECF) calculated a benchmark lifecycle analysis (LCA) figure for an average Dutch aluminium-frame commuter bicycle, attributing a small minority of emissions to the bicycle’s production and the large majority to the metabolism of the rider, in their report Cycle More Often 2 Cool Down the Planet. According to more recents updates, this figure rises further still. The full methodology for the calculation is outlined in Box 1, and the set of assumptions and results is laid out in Table 1.
BOX 1: THE SCIENCE BIT
The carbon emissions of travelling by bicycle per kilometre
For forms of transportation, this is calculated using a Life Cycle Analysis (LCA) (Blondel et al., 2011), which totals the emissions across the entire course of a product’s life:
- Extraction of the raw materials
- The manufacturing process
- Distribution of the product
- Its eventual disposal
This total is expressed as grams of CO2e per passenger per kilometre of travel, the same metric that underpins most current carbon policy and product labelling.
LCA = (Production + Distribution + Disposal emissions ÷ km) + (Extra kcal ÷ km × food emissions coefficient)
The resultant LCA number is then combined with emissions from the transport mode’s fuel source to give a final score. In the case of bicycles, this involves first calculating the extra calories (kcals) burned per kilometre of travel and multiplying this by a dietary emissions coefficient, as described by both Stott (2025) and the European Cycling Federation (ECF) (2011).
The ECF derived their coefficient by assuming a cyclist travelling at 16 km/h, resulting in a calorie deficit of 11 kcal. Assuming these calories are replaced, and averaging emissions across various food categories, this produced a figure of 1.44 g CO2e/kcal. A more robust, gender-neutral coefficient can be derived using Scarborough et al. (2023), a landmark study of 55,504 UK adults published in Nature Food, which calculated dietary greenhouse gas emissions standardised to a 2,000 kcal/day diet (the UK adult daily guideline) across diet groups. For medium meat-eaters (50–99g meat/day), representative of the average UK adult diet, they report emissions of 5.63 kg CO2e per day for a 2,000-kcal diet. Dividing through, this yields an updated, gender-neutral dietary emissions coefficient of 2.81 g CO2e/kcal.
How Accurate Can The Calculation Be?
It’s important to note that this is quite a rough estimate, making use of dietary emission averages and assuming that every calorie burned will be replaced. It also has the potential to vary widely:
- in magnitude and proportion with gender
- with changes in speed
- for different activity types (i.e. exercise instead of commuting)
- for different bicycles
- by cyclist weight
- by bicycle construction
For faster riders, Sissons’ (2020) estimate of calories burned at racing pace produces a higher LCA figure still, again detailed in Table 1.
Do Keen Cyclists Create Lower Emissions?
It’s worth noting that for riders like those circling Richmond Park at speed, the calculus is somewhat different. When cycling functions as dedicated exercise rather than a replacement for another mode of transport, the net emissions benefit is more complex: the rider may well exercise in some form regardless, and the calories burned, and subsequently replaced, may actually be additional to their baseline intake. For these cyclists, the total LCA figure is less relevant as an emissions comparison tool.
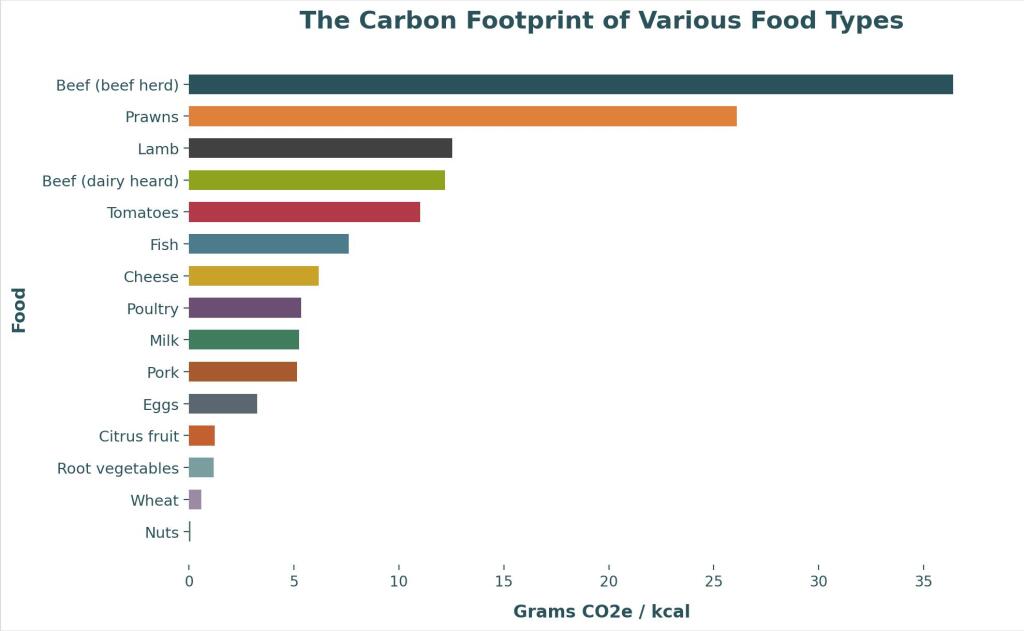
In any case, with the metabolic term making up the large majority of the total LCA (see Table 1), dietary changes in favour of lower-emission foods can significantly reduce the carbon footprint of cycling. Figure 2 exhibits the grams of CO2e /kcal of various common food types, allowing calculation of the fuel-related emissions if the calorie deficit was replaced by purely one food category. In reality, most individuals will likely eat a balanced mix of these and other food categories.
| Parameter | Value | Source |
| Assumed bicycle lifespan | 19,200 km | ECF, 2011 |
| Commuting speed | 16 km/h | ECF, 2011 |
| Extra calorie burn at commuting pace | 11 kcal/km | ECF, 2011 |
| Original ECF dietary coefficient | 1.44 g CO₂e/kcal | ECF, 2011 |
| Medium meat-eater emissions (2,000 kcal/day diet) | 5.63 kg CO₂e/day | Scarborough et al., 2023 |
| Updated gender-neutral dietary coefficient | 2.81 g CO₂e/kcal | Derived from Scarborough et al., 2023 |
| Bicycle production emissions (commuting LCA) | 5 g CO₂e/km (23.8%) | ECF, 2011 |
| Original total LCA, commuting | 21 g CO₂e/km | ECF, 2011 |
| Updated total LCA, commuting | ≈35.9 g CO₂e/km | Calculated |
| Racing speed | 30 km/h | Sissons, 2020 |
| Extra calorie burn at racing pace | 28.13 kcal/km (844 kcal/h) | Sissons, 2020 |
| Total LCA, racing pace | 47.2 g CO₂e/km | Calculated |
| Dietary share of racing-pace LCA | 94.1% | Calculated |
Is Cycling the Lowest Emissions Form of Transport?
At its highest estimate (47.2 grams CO2e/km for a rider cycling at pace), cycling’s total footprint still remains lower than the emissions produced by most other common forms of transport; a fuller comparison, and the numbers behind it, will feature in Part 3. What’s worth underlining now is what that footprint is actually made of: with the dietary term accounting for the vast majority of total emissions (76.2% at commuting pace, rising to 94.1% when cycling for exercise), the bicycle itself, its production, distribution, and eventual disposal, is almost a rounding error by comparison. Even with the highest emissions diet, a rider has a footprint so small to begin with that cycling remains, by a wide margin, one of the greenest ways to get from A to B.
In Richmond, Sunday morning has grown long, reaching to open the gate for afternoon. With refuelling on their minds, cyclists in their droves begin their seemingly choreographed wind-down, exiting the park in an incredible outflux of colour and sound. As calm returns and the great red deer begin to emerge once more, the ambient whisper of traffic on the surrounding motorways remerges as the predominant sonic backdrop, pierced only by the periodic Doppler-whistle of aircraft bound for Heathrow drifting overhead. From this ambient concerto emerges another, more pressing question: how does the emission profile of cycling compare to other forms of transport?
More information on the carbon footprint of cycling:
- Blondel, B., Mispelon, C., & Ferguson, J. (2011). Cycle more often 2 cool down the planet: Quantifying CO2 savings of cycling. European Cyclists’ Federation. https://ecf.com/media/resources/2016/ECF_CO2_WEB.pdf
- Ritchie, H. (2020, January 24). You want to reduce the carbon footprint of your food? Focus on what you eat, not whether your food is local. Our World in Data. https://ourworldindata.org/food-choice-vs-eating-local
- Our World in Data. (n.d.). Greenhouse gas emissions per 1,000 kilocalories [Chart]. https://ourworldindata.org/grapher/ghg-kcal-poore
- Roser, M., Ritchie, H., & Rosado, P. (2013). Daily supply of calories per person [Dataset]. Our World in Data. Data adapted from Food and Agriculture Organization of the United Nations and other sources. https://ourworldindata.org/grapher/daily-per-capita-caloric-supply
- Scarborough, P., Clark, M., Cobiac, L., Papier, K., Knuppel, A., Lynch, J., Harrington, R., Key, T., & Springmann, M. (2023). Vegans, vegetarians, fish-eaters and meat-eaters in the UK show discrepant environmental impacts. Nature Food, 4(7), 565–574. https://doi.org/10.1038/s43016-023-00795-w
- WWF-UK. (2018). Food in a warming world: The changing foods on the British plate. WWF-UK. https://www.wwf.org.uk/sites/default/files/2018-03/Food_in_a_warming_world_report.PDF
- BBC News. (2018, February 21). A third of UK adults ‘underestimate calorie intake’. BBC News. https://www.bbc.co.uk/news/health-43112790
- Sissons, B. (2020, November 25). Comparing biking and running for fitness and weight loss. Medical News Today. https://www.medicalnewstoday.com/articles/biking-vs-running
- Kaufman, M. (2020, July 13). The devious fossil fuel propaganda we all use. Mashable. https://mashable.com/feature/carbon-footprint-pr-campaign-sham/
- Environmental Audit Committee. (2008). Personal carbon trading (Fifth Report of Session 2007–08, HC 565). House of Commons. https://publications.parliament.uk/pa/cm200708/cmselect/cmenvaud/565/565.pdf
- Department for Environment, Food and Rural Affairs (Defra). (2008). Synthesis report on the findings from Defra’s pre-feasibility study into personal carbon trading. https://www.flemingpolicycentre.org.uk/Synthesis.pdf
